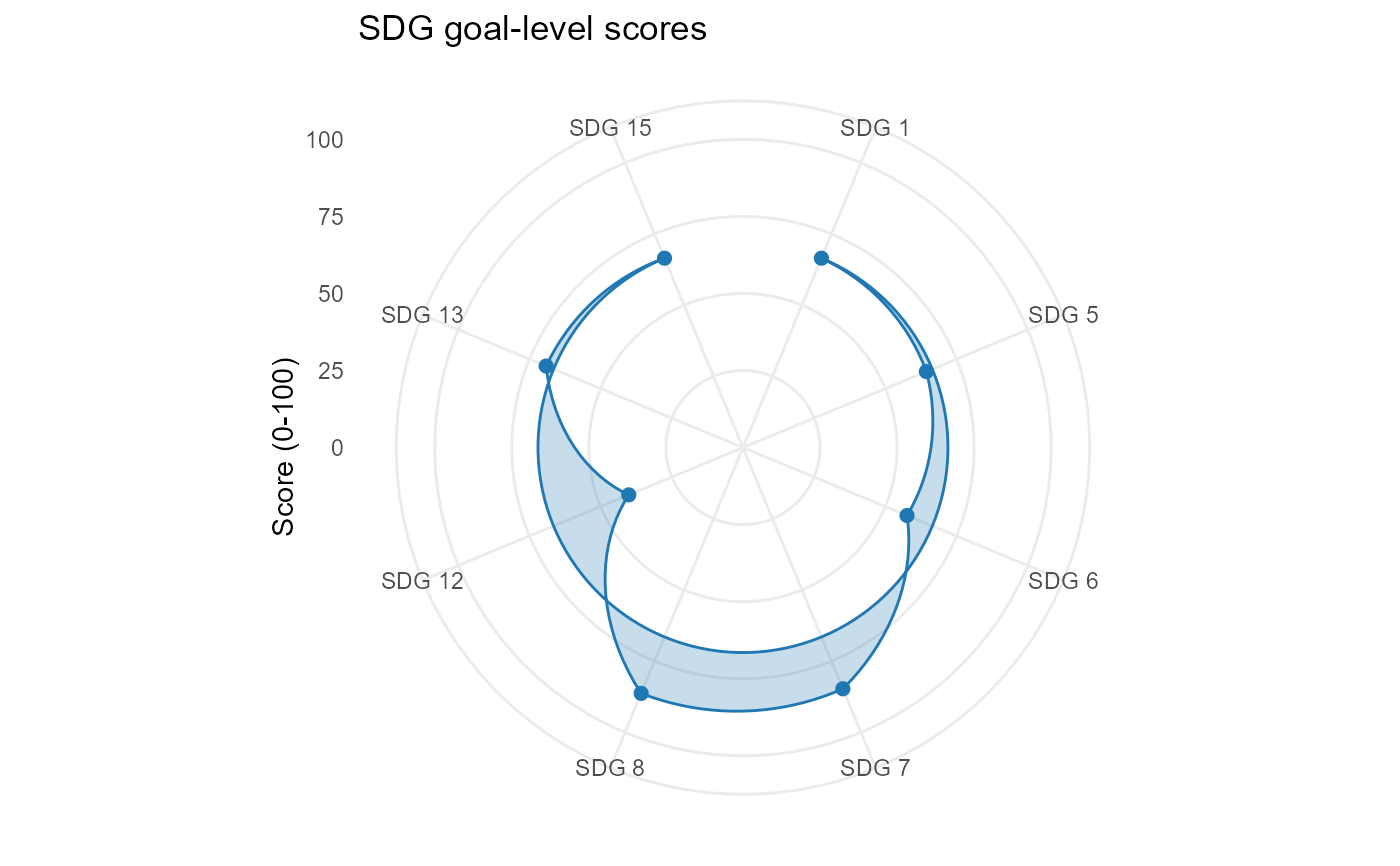
SDG radar chart for a site scorecard
plot_sdg_radar.RdPlots goal-level SDG scores as a radar (polar) chart.
Examples
sc <- score_site_sdg(demo_mine_sites[demo_mine_sites$site_id ==
                       "CU-ATAC" & demo_mine_sites$year == 2024, ])
plot_sdg_radar(sc)